RGB tile drawing in hips package
The hips package now supports RGB tile drawing. To make this possible, the output image dimensions had to be altered according to the following configuration:
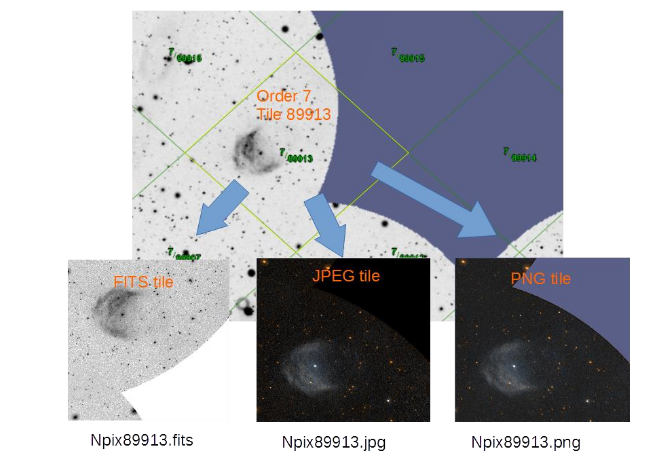
The output image shape is two dimensional for grayscale, and three dimensional for color images:
shape = (height, width)for FITS images with one grayscale channelshape = (height, width, 3)for JPG images with three RGB channelsshape = (height, width, 4)for PNG images with four RGBA channels
In addition to this, in-case of JPG and PNG format, the tiles are flipped in the vertical direction, which leads to incorrect tile drawing using the previous technique. The figure below is taken from the hips paper, figure 6, which shows the inverted tiles.
To overcome this, the following function was introduced which handles the creation of tile corner pixel coordinates, which are used during projective transformation:
def tile_corner_pixel_coordinates(width, file_format) -> np.ndarray:
    """Tile corner pixel coordinates for projective transform.

    The HiPS tile pixels (given by the NumPy array ``tile.data`` in our code)
    have a different orientation for FITS than for JPEG or PNG.
    This is noted in the HiPS spec (http://www.ivoa.net/documents/HiPS/20160623/index.html):
    > Contrary to FITS convention, in JPG and PNG the lines of the pixel
    array are stored in top->down direction.

    The order of corners below is chosen such that it matches the order
    of the pixel corner sky coordinates from ``healpix_pixel_corners``:

    - north
    - west
    - south
    - east

    which then gives correct results when used to compute the projective transform.
    """
    w = width - 1
    if file_format == 'fits':
        corners = [
            [w, 0],  # north
            [w, w],  # west
            [0, w],  # south
            [0, 0],  # east
        ]
    elif file_format in {'jpg', 'png'}:
        corners = [
            [w, w],  # north
            [w, 0],  # west
            [0, 0],  # south
            [0, w],  # east
        ]
    else:
        raise ValueError(f'Invalid file_format: {file_format}')

    return np.array(corners)
As a result of this new update, the user can now draw RGB tiles. The following image was created from the DSSColor survey using JPG file format. For this image, the FoV (field of view) was set to 50 degrees, so we get a nice large image:
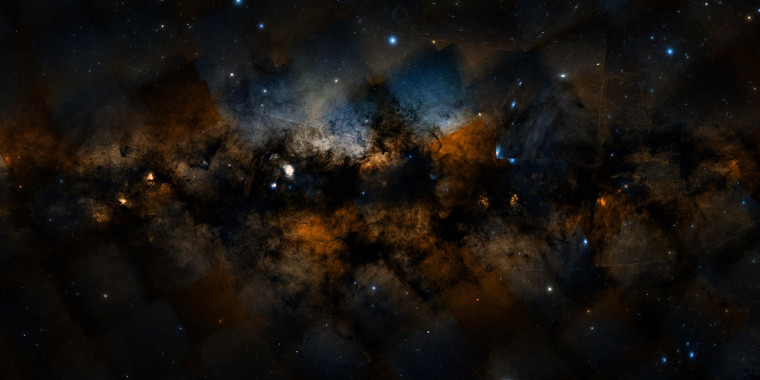
However, there is still an issue which is yet to be fixed. Currently, we simply make full sky images for each projected tile and then sum them up, this leads to bright lines at tiles edges as evident from the image above. This is caused due to pixels being drawn and summed twice at the same location.