Plotting graphical data using RRDtool and a Python Collectd plugin
Collectd is Unix daemon used for periodically collecting system usage statistics, which can include identifying CPU or memory bottleneck issues. The collected data can then be transformed to graphs using RRDtool or a Grafana dashboard (Grafana provides real time graphs and complex search queries).
The daemon itself is modular and functions through external plugins with each plugin performing a distinct function. This post will explore a plugin which collects weather information of a given city. The first section will explain how the plugin configuration works and how to plot a graph of the output data using RRDtool. Finally, we will delve into the plugin internals and see how it is written.
Note: For an intro on how to setup Collectd, refer to this wiki.
Plugin configuration
All enabled Collectd plugins must be listed in the collectd.conf file. The default file paths used by Collectd can be viewed with:
$ collectd -h

Builtin defaults:
  Config file       /etc/collectd.conf
  PID file          /var/run/collectd.pid
  Plugin directory  /usr/lib/collectd
  Data directory    /var/lib/collectd
The plugins lie under the /usr/lib/collectd directory, by default.
Note: Python plugins might not work when placed under the default plugin directory, as this causes anomalies when importing external modules.
Invoking the plugin
Let’s say we have a script named log-weather.py which we want to periodically call using Collectd. We first need to change its path to our custom plugins directory:
$ cp /path/to/log-weather.py /usr/lib/collectd/python/
Next, we will add this plugin to our /etc/collectd.conf config file. We also need to load the Python plugin (this exposes the collectd Python module which we then import in our script):
$ cat /etc/collectd.conf
LoadPlugin python
<Plugin python>
    ModulePath "/usr/lib/collectd/python/"
    Import "log-weather"
    <Module weather_logger>
        CITY    "<city>"
        API_KEY "<api_key>"
    </Module>
</Plugin>
The import structure remains similar for all Python plugins, except for the module path, the module name, and its configuration parameters.
Importdirective: This takes the script name as its value. Notice how this differs from the module name in the following line. We’ll see this in detail in a later section.Moduletag: This module requires two configuration parameters,CITYandAPI_KEY. It calls an external API with the given key to collect the weather information.
Enabling RRDtool
As we intend to plot the collected data at the end, we will enable the RRDtool plugin. This plugin enables writing the data dispatched by our script to an RRD (Round Robin Database) file.
LoadPlugin rrdtool
Setting the call interval
In our /etc/collectd.conf file we can tweak the frequency by which our plugin is called with the Interval directive. This expects a value in seconds:
Interval 1800
Our script will now collect the weather information every 1800 seconds, or every half an hour.
Note: It is also possible to set the interval for each plugin separately. This requires setting the interval in the
register_readfunction, which we will see later.
Starting the Collectd service
Once the configuration is done, we must (re)start the Collectd service using systemd.
Note: this step might be different based on your Linux distribution. Consult the Collectd Wiki for more details.
Enabling the Collectd systemd service will start Collectd when the user logs in on their computer.
$ systemctl start collectd
$ systemctl enable collectd
Plotting the data
As soon as the Collectd service is running, data will be written to the RRD file using the RRDtool plugin which we enabled earlier. This data is stored inside the data directory, which in our case is /var/lib/collectd/home/weather_alert/temperature.rrd.
To plot this data we will use the rrdtool Linux utility. (This tool is different from the one used by Collectd, which uses the librrd API for writing the data.) We will first view the information written to the temperature.rrd file with:
$ rrdtool info temperature.rrd
rrd_version = "0003"
step = 2
last_update = 1589090986
header_size = 3496
ds[value].index = 0
ds[value].type = "GAUGE"
...
And then proceed with creating the graph:
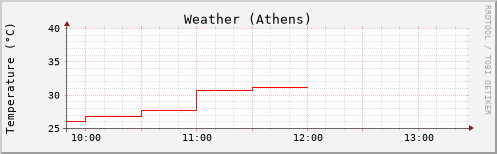
$ rrdtool graph weather.png \           # (1)
  --title "Weather (Athens)" \          # (2)
  --vertical-label "Temperature (°C)" \ # (3)
  --start now-8000s --end now \         # (4)
  DEF:a=temperature.rrd:value:AVERAGE   # (5)
It produces this result:
Let’s go over the above command in detail:
- We specify the name for the output graph.
- This title appears at the top of the graph.
- The vertical label appears to the left of our x-axis.
- Each graph has a start and end time which can be provided either as a relative or absolute timestamp value.
now-7200smeans that we will view weather statistics from the past 2 hours up till now. - The DEF directive defines the graph variable
a, which is followed by this pattern<source file>:<key>:<metric>.<source file>contains the path to the RRD file.<key>is what we saw in therrdtool infocommand asds[value]. In this case we will plot thevaluekey.<metric>is usually eitherMIN,MAX, orAVERAGE. It is also visible in theinfooutput.
Note: this tool can produce some very complex graphs, but for our use case we will just stick with a simple line graph.
Having configured the script we will now go over the plugin structure and see how the weather collection script is written.
Weather Logger plugin
The Python Collectd plugin begins by importing the collectd module. It then defines a series of callback functions. For our use case we will only define a config and a read callback function.
import collectd
import requests

PLUGIN = 'weather_alert'
CITY, API_KEY = '', '' # placeholders
def config_callback(config):
    global CITY, API_KEY
    for node in config.children:
        key = node.key.lower()
        val = node.values[0]
        if key == 'city':
            CITY = val
        if key == 'api_key':
            API_KEY = val

    if not CITY:
        collectd.error('{} plugin: [Error] The city name must be provided'.format(PLUGIN))
    if not API_KEY:
        collectd.error('{} plugin: [Error] The API key must be provided'.format(PLUGIN))
The configuration function above sets the CITY and API_KEY variables that we passed over from the config file. Later on we will see how to view Collectd logs.
We now define the read_callback function:
def read_callback():
    weather = requests.get(f'http://api.openweathermap.org/data/2.5/forecast?q={CITY}&units=metric&appid={API_KEY}').json()
    weather_metric = collectd.Values(plugin=PLUGIN, type='temperature')

    try:
        weather_metric.dispatch(values=[weather['list'][0]['main']['temp']])
    except Exception as e:
        weather_metric.dispatch(values=[-1])
        collectd.error('{} plugin: [Error] Unable to run {}'.format(e))
We call the OpenWeatherMap API for collecting the data. The collectd.Values() function registers the plugin name which we later reference in the config file. The weather_metric.dispatch() function is what writes the data to the RRD file.
The final step is to register these two functions with the collectd module:
collectd.register_config(config_callback)
collectd.register_read(read_callback)
Diagnosing plugin issues
Let’s try removing the CITY from our /etc/collectd.conf configuration file and see if it raises any errors. We restart the Collectd service and check its status:
$ systemctl restart collectd.service
$ systemctl status collectd.service
● collectd.service - System statistics collection daemon
     Loaded: loaded (/usr/lib/systemd/system/collectd.service; enabled; vendor preset: disabled)
     Active: active (running) ...
...
May 10 13:42:07 home collectd[29390]: weather_alert plugin: [Error] The city name must be provided
It can also be helpful to view the full logs for more details. By default, these are present in the /var/log/collectd.log file.